

SITCOMTN-145
TEA vibration analyses#
Abstract#
This Technote (TN) summarizes all analyses conducted to understand the vibrations observed on the Top End Assembly (TEA) on March 10 and March 11, 2024.
Introduction#
On the night of Saturday, March 9, during laser tracker testing, measurements were taken at zenith on the ComCam hexapod. Observations in the laser tracker’s watcher window indicated that the laser could not lock onto its targets, with target movement showing approximately 2 mm displacement in the X-axis. As a precautionary measure, the telescope was placed in Lockout/Tagout (LOTO), and personnel proceeded to the 8th floor. There, an unusual noise was immediately detected from the top end of the telescope, described as resembling:
an irregularly rotating fan (intermittent sputtering),
deteriorating bearings, and
a metallic rattling sound.
The noises were reported in the #comcam-work-log channel. Compensation on both hexapods was then zeroed and disabled, with M2 set to closed-loop mode, while ComCam remained in a warmed state.
On Sunday, March 10, personnel returned to the summit in the morning. Upon inspection, the same noise persisted. With remote support, the cold2 cryotel was powered down, though this had no impact on the noise. Subsequently, an internal fan within ComCam was also turned off, but this adjustment likewise did not alter the noise.
Personnel awaited confirmation that ComCam had sufficiently warmed up, allowing for telescope movement. Positioned at zenith, further measurements were taken, and by approximately 1 pm, the laser tracker successfully re-acquired the camera targets. Upon returning to the dome, it was confirmed that the noise had ceased, thus eliminating the initial vibration effect observed.
The attached video clip demonstrates the variation in ambient noise levels, recorded at 11:30 PM on Saturday, 11:30 AM on Sunday, and 1:00 PM on Sunday, showing a distinct reduction in noise.
Results#
Analize vibration on the TMA Top-End-Assembly and the rotator telemetries#
According to SITCOM-1285, on March 15 (Friday), soak tests were conducted using the Rotator in various configurations to investigate possible vibrations during this period and to test the hypothesis that the Rotator could be the source of the observed vibrations.
Additionally, on March 21 (Thursday), BLOCK-197 was executed multiple times. OBS-498 reports multiple faults on the hexapods associated with the compensation mode and suggests possible vibrations during execution, warranting further review.
Finally, on March 25, BLOCK-197 was executed twice: first with the Rotator in ENABLED mode, and second with the Rotator in STANDBY mode, with its cabinet turned off. This comparison aims to assess the vibration levels under each condition.
Results for analysis SITCOM-1285#
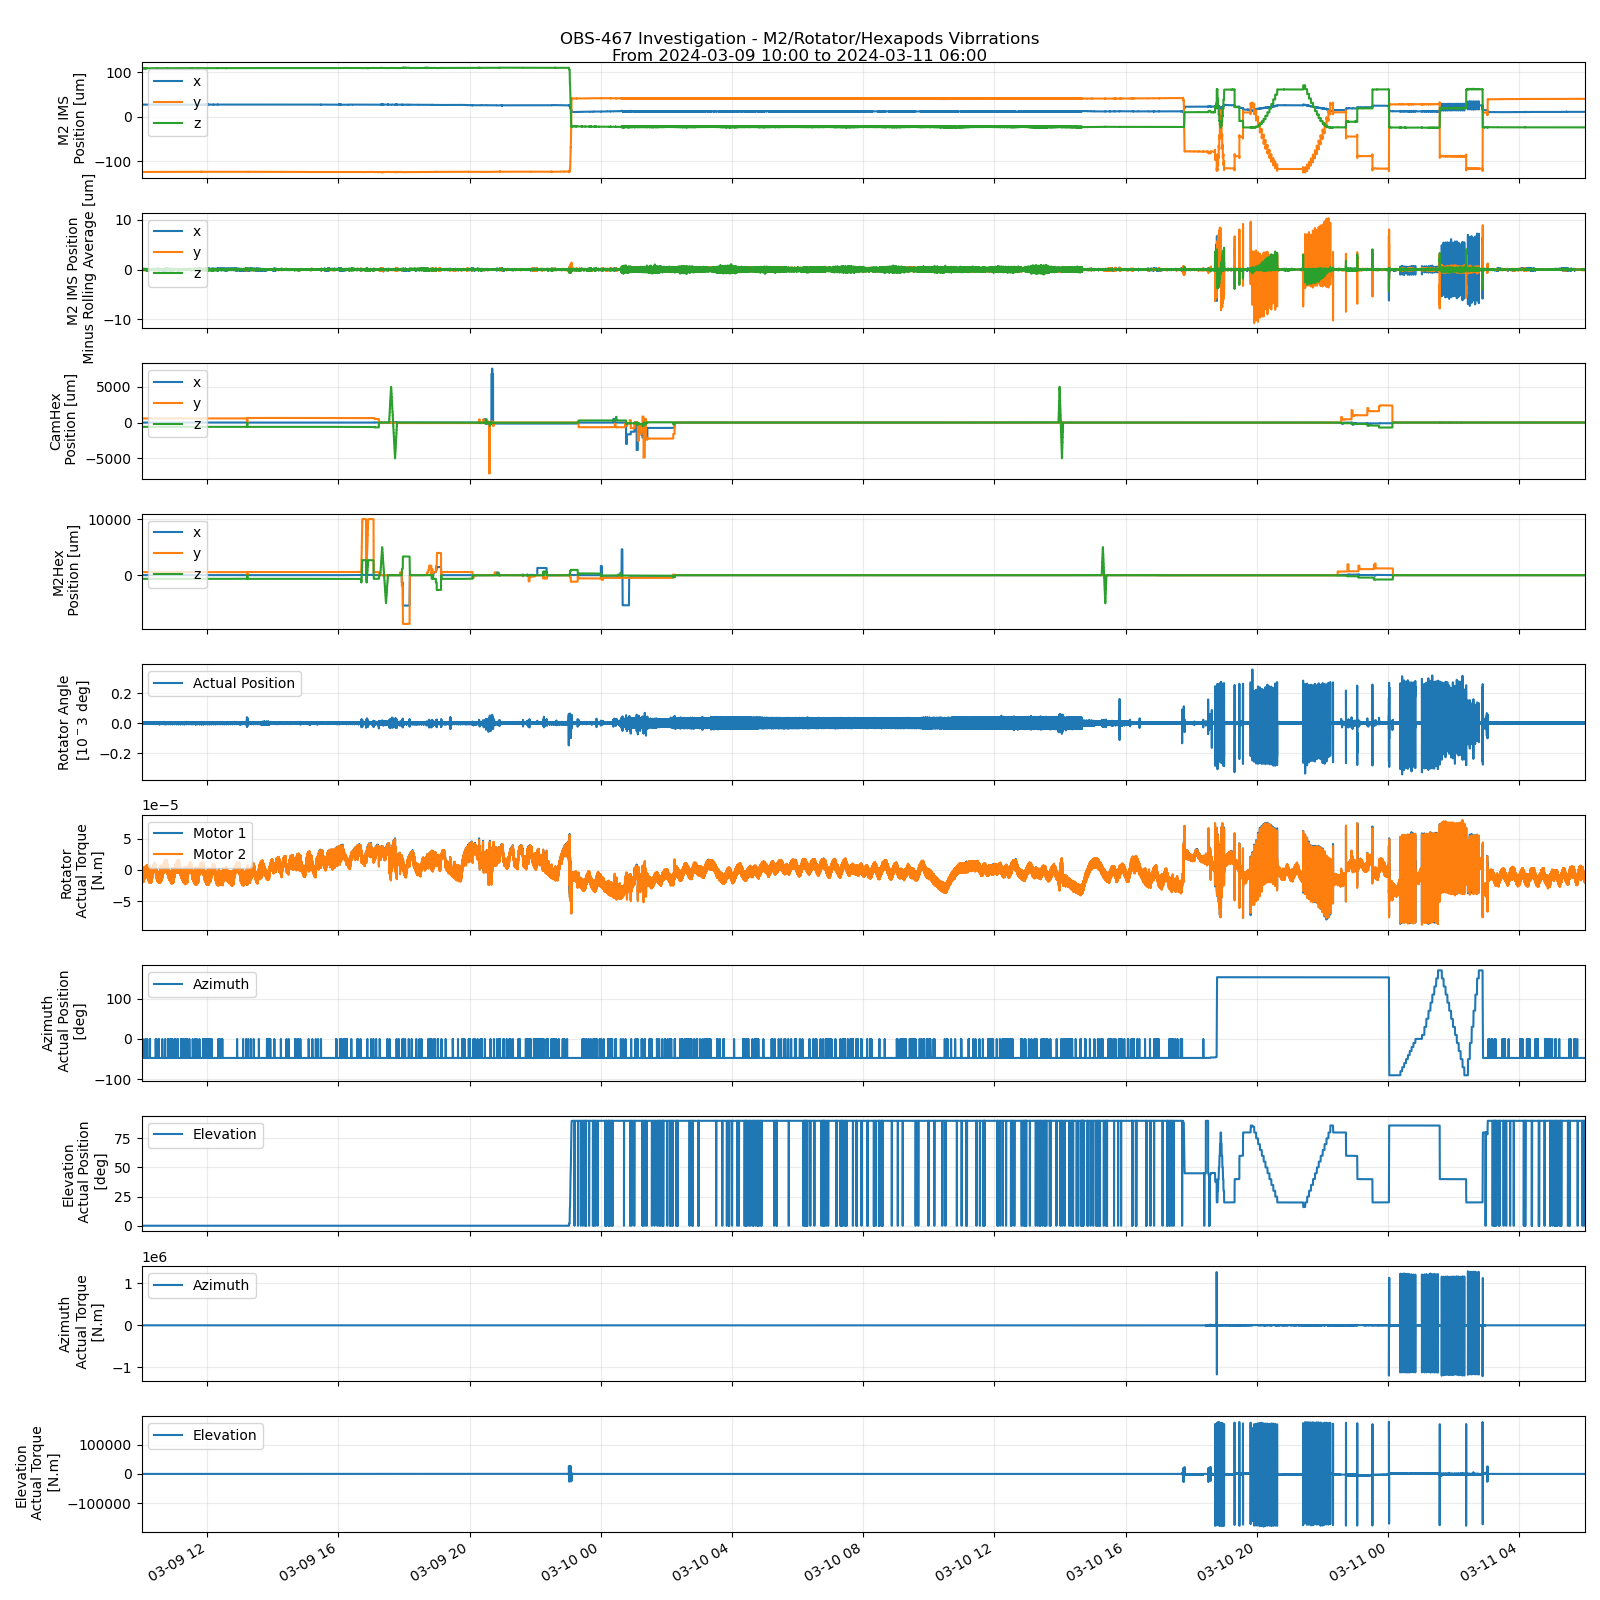
Fig. 1 Telemetry of various subsystems around the vibration event.#
The plots above indicate low-amplitude vibrations on both the Rotator and M2 from 00:40 to 15:00 UTC on March 10. According to the OLE logs, the initial problematic measurements using the Laser Tracker began around 00:44, which aligns with the observations in the plots.
A review of the Rotator’s actual position data in Chronograf revealed that these vibrations started precisely at 00:37:55. By 14:41:13, the amplitude of these oscillations had reduced, continuing at a diminished level until 16:08:41.
Regarding amplitude, a preliminary visual inspection shows that the Rotator’s oscillation amplitude is approximately 0.1 x 10^-3 degrees, while M2 exhibits oscillations around 1 μm. Neither of these amplitudes accounts for the 2 mm displacement detected by the Laser Tracker.
Analysis of the hexapod data reveals two instances of warm-up sequences: one around 18:00 UTC on March 9 and another near 14:00 UTC on March 10. These sequences provide baseline data on the typical movement range of the hexapods. Notably, both hexapods were subject to significant movement near the onset of the detected vibrations and oscillations.
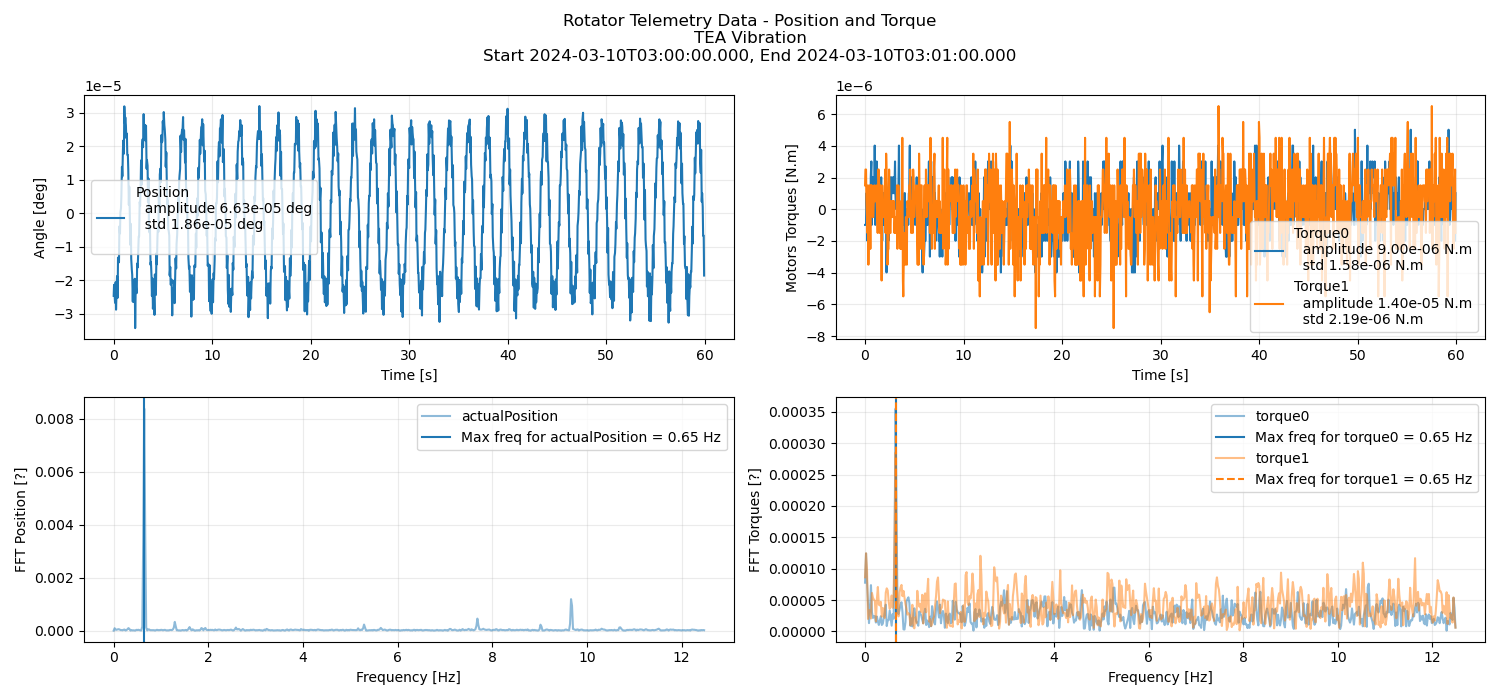
Fig. 2 Rotator telemetry data duration vibration event.#
Extract dominant frequencies from sound waves in video associated with vibrations on Top-End Assembly#
Three videos with sound were recorded from the Top End Assembly and compiled into a single file, which is attached here. The objective is to analyze the dominant frequencies present in different sections of the video.
Results for analysis SITCOM-1345#
Plots and description here:
Extract dominant frequencies from sound waves in video associated with vibrations on Top-End Assembly II#
In these analyses we wanted to explore the dominant frequencies for all three videos separately. For every signal we plot the spectrograms, Fast Fourier Transform (FFT) and the Power Spectral Density (PSD). None of the results are conclusive. Analyses are repeated on the denoised signals but the results stay inconclusive. Here we will show the results of the original audio signals.
Results for analysis SITCOM-1397#
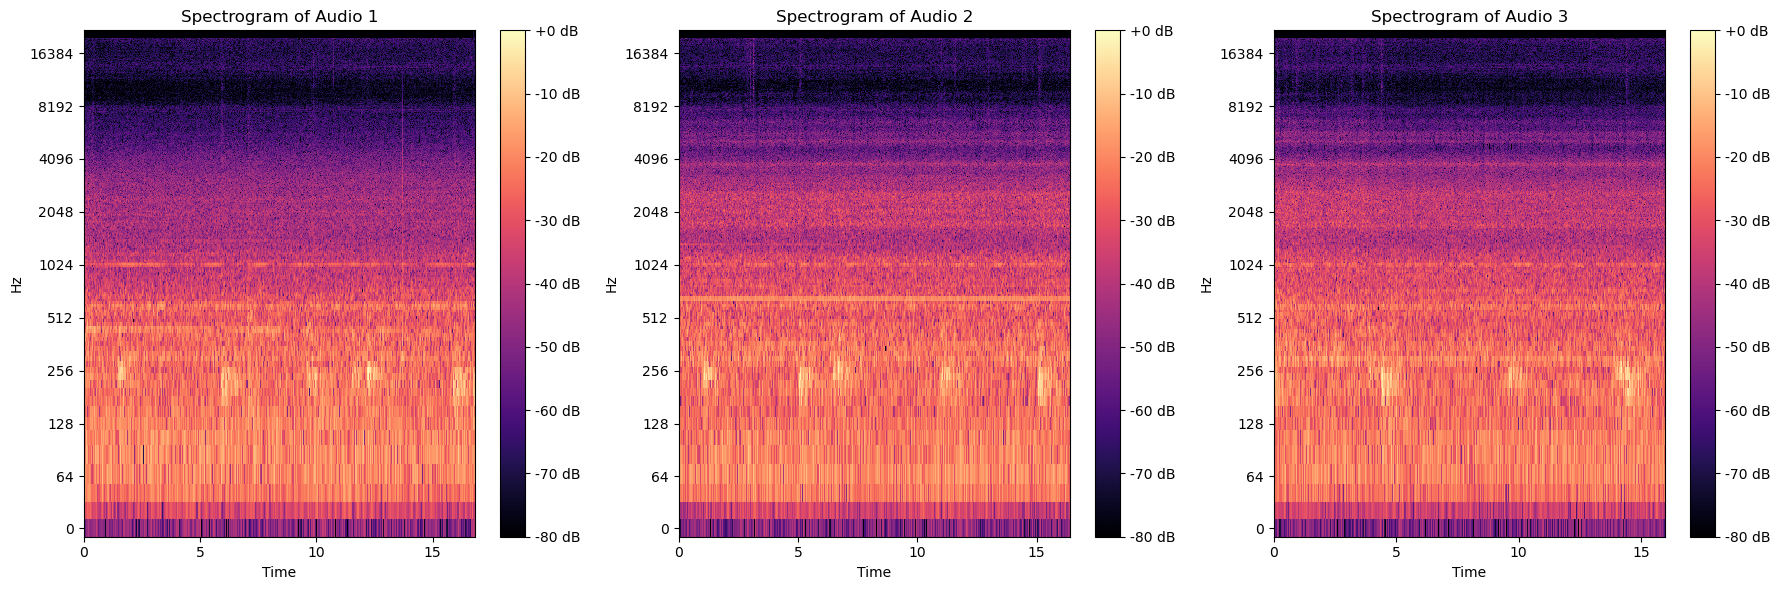
Fig. 3 Spectrograms of the 3 audio signals separately#
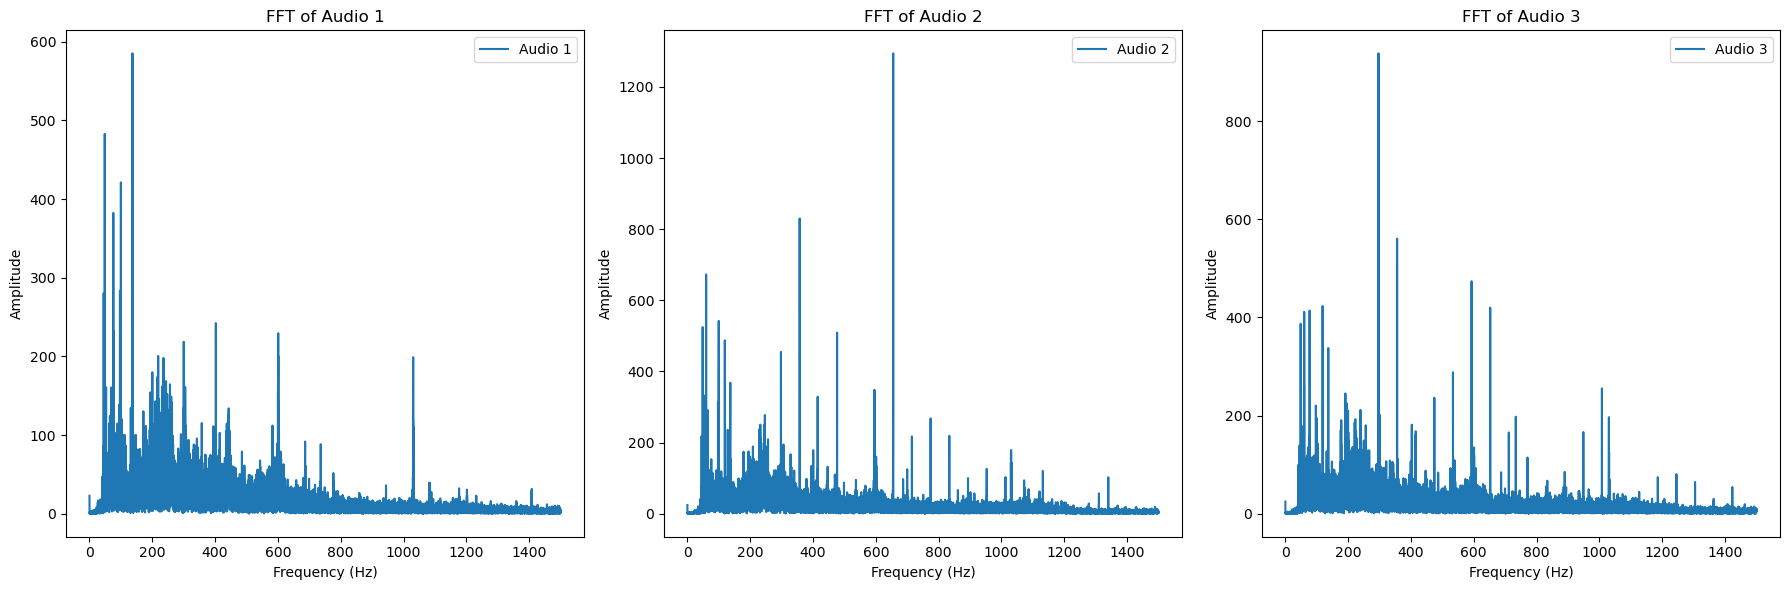
Fig. 4 Fast Fourier transformation for the 3 audio signals.#
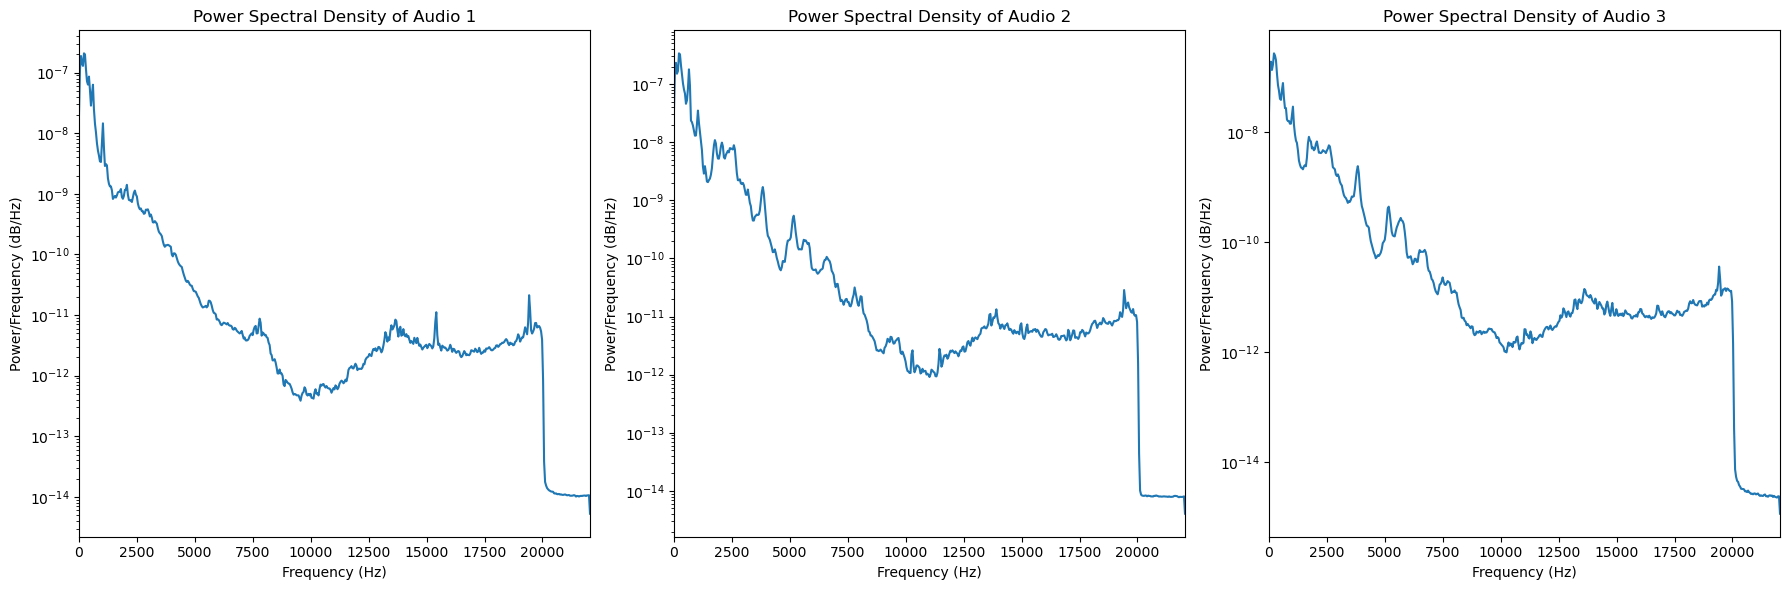
Fig. 5 Power Spectral Density for the 3 audio signals.#
TEA Vibration Analysis using MTCamHexapod telemetries#
Each sub-component of the TEA requires an analysis to detect vibrations using system telemetry data, as well as force and torque measurements across all axes. This analysis will focus on the MTCamHexapods to produce foundational plots, including position and torque/force plots with their respective FFTs. Position and torque/force plots will display peak-to-peak numerical values for each telemetry, while FFT plots will indicate the numerical value of the dominant frequency.
Results for analysis SITCOM-1485#
Plots and description here:
TEA Vibration Analysis using MTM2Hexapod telemetries#
This analyses is the same as the previous one but with MTMHexapod telemetries.
Results for analysis SITCOM-1486#
Plots and description here:
TEA Vibration Analysis using MTM2 telemetries#
The following plots consider MTM2 telemetries. In this case positions, rotations (from the independent measurement system) and displacements are produced per axis, together with their FFT.
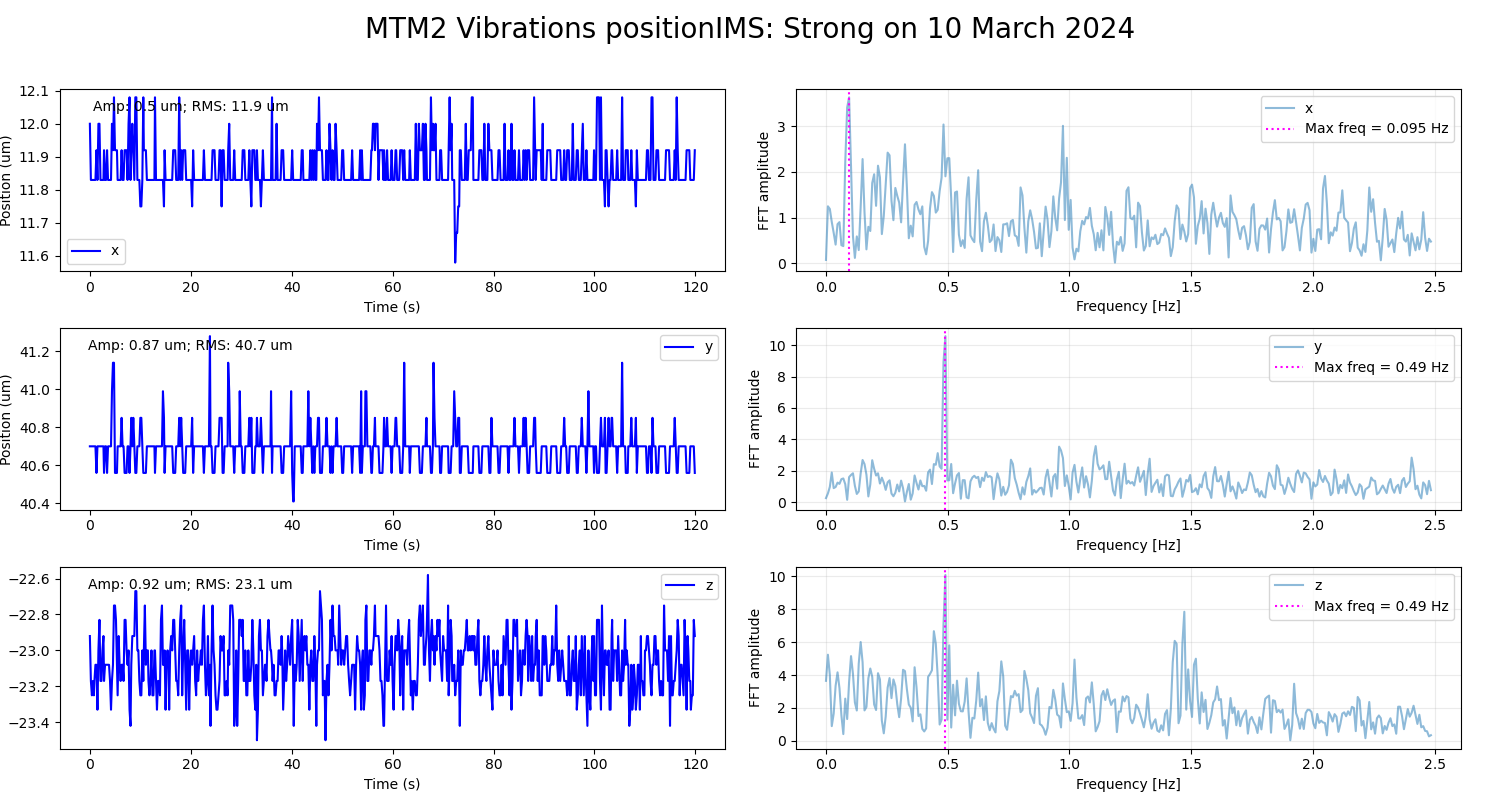
Fig. 6 IMS position measurements during vibration event and FFT.#
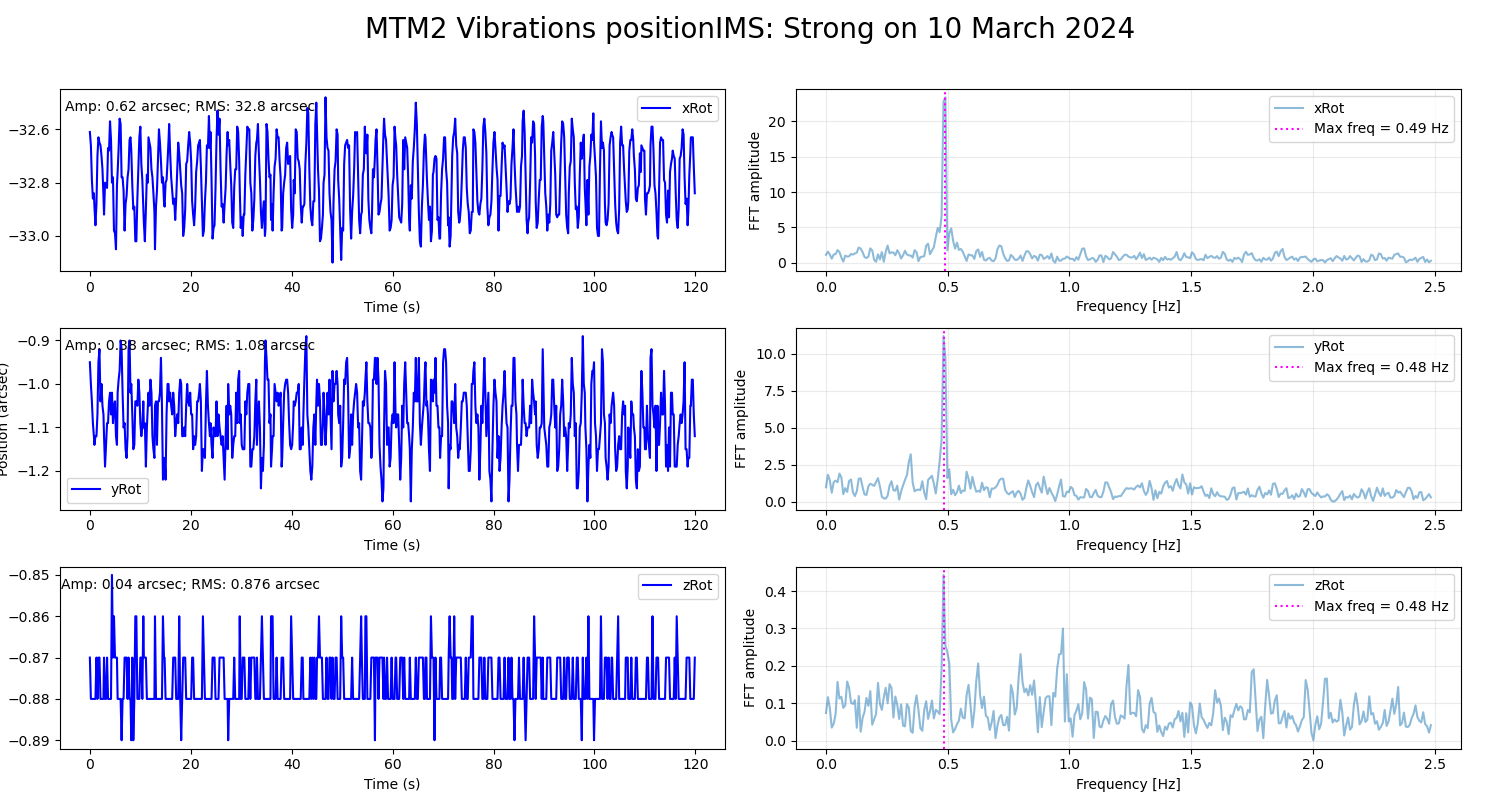
Fig. 7 IMS rotation measurements during vibration event and FFT.#
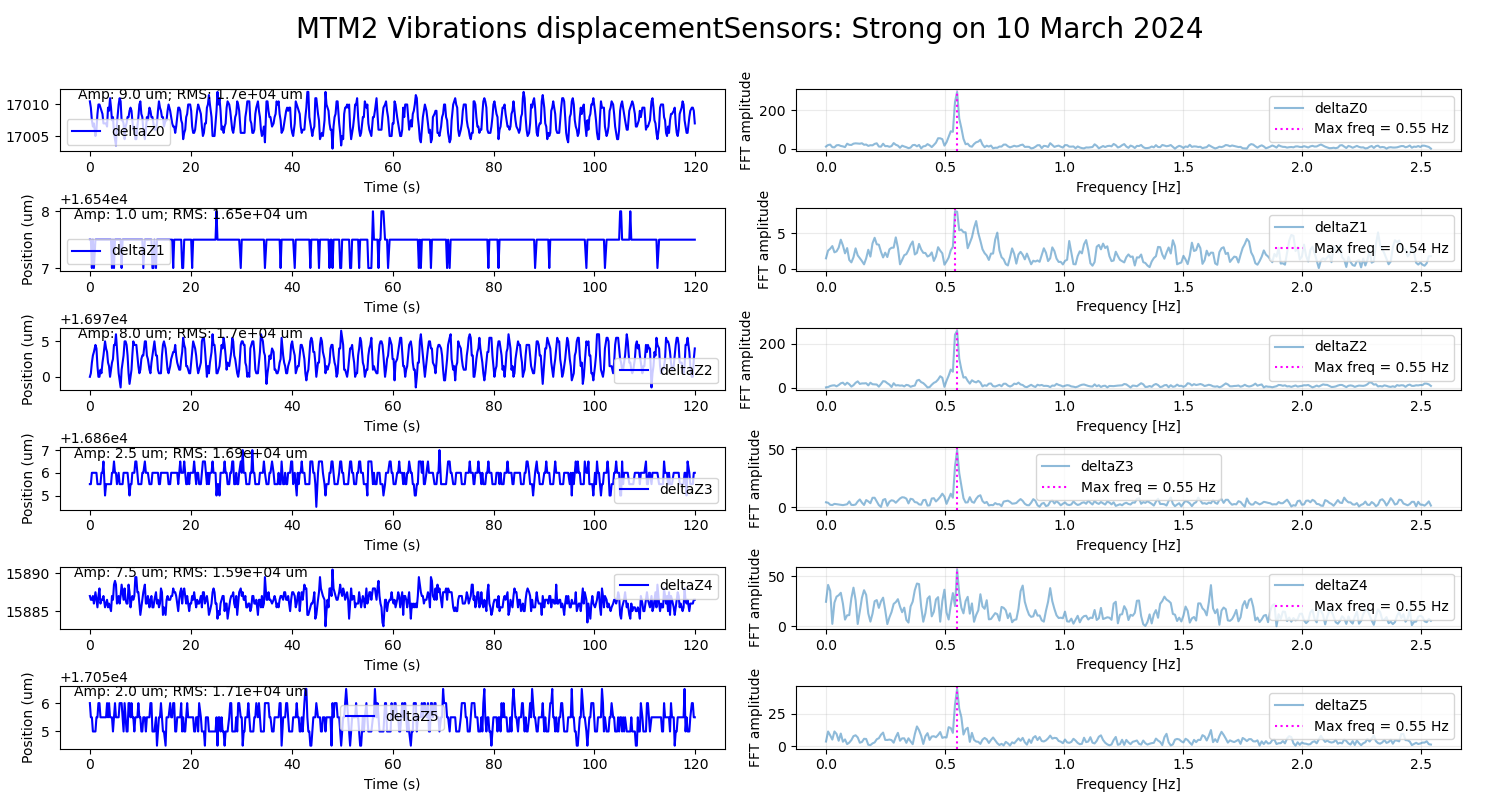
Fig. 8 Z-axis displacements on actuators (TBC) during vibration event and FFT.#
Upon study of the IMS position and rotation variables, a clear 0.5 Hz vibration or oscillation is seen. This can be seen in the ‘y’ direction and xRot and yRot rotation axes more clearly. The displacement sensors detect this clearly in the delta or displacement as well, in all tangent link points. These values are to be contrasted with those from the hexapods as the relative amplitudes could say something about the origin of the vibration.
TEA Vibration Analysis using TMA telemetries#
This analyses is the same as the previous one but with TMA telemetries.
Results for analysis SITCOM-1488#
Plots and description here:
Discussion#
A detailed discussion could have its own section after the Results, but is not always necessary. This is particularly useful when the amount of tables and/or plots require an overall evaluation to be explained in a single section.
Conclusions#
Conclusions should include a clear cut status of the resolution of the goal the technote was designed to address. In case of requirement verification, this would include PASS/FAIL assessments for each.
If a clear resolution is not found at this time, it is advisable to add a path to said resolution for further testing, as sometimes technotes are only meant to provide a snapshot of the situation they are describing. This would include links to new tickets that address these next steps that may already exist by the time of wrapping up the current technote.
This section should not be too long to provide a quick ‘single-glance’ summary, that together with the abstract, would provide a complete sself contained information piece on the issue at hand.
Example: Using star tracker data from camera XX on the soak tests performed on observation day XXXX-YY-ZZ we have been able to verify requirement RRR, in mostly all azimuth-elevation combinations. However, in 60% of the cases were pointing was to an elevation below 30 degrees, the offset was beyond the requirement, reaching almost 8 arcseconds.
Appendix#
Technote Writing Guide#
In order to start a technote, as well as some useful tips for using reStructured text, please refer to this presentation by the Rubin documentation team.
A general guide for Rubin technotes can be found in the LSST user guide.
ReStructured text supports LaTeX-style math using the ‘math’ environment and inverted commas: :math:`x^2+y^2=z^2` will translate into \(x^2+y^2=z^2\).
See this reference for the official reStructured text documentation.
Aditionally, consider using monospace font for file and directory names.